Paid Social Blueprints


Creative Reporting Blueprint
Learn how to leverage data from your paid social campaigns to transform your creative testing. Our Creative Reporting Blueprint will guide you how to set up an effective creative reporting system, and help you optimize creative testing strategies for maximum impact.


Introduction
With the growing importance of ad creatives in paid social, creative reporting is a must-have for success. Marketers are constantly navigating between innovation and efficiency, striving to understand which ad creatives resonate most with their audience while optimizing for maximum return on investment. However, without a structured approach, this process can easily become prone to error, and be often based on intuition rather than data-driven insights.
At Kitchn.io, we understand that the true power of advertising lies not just in the creatives themselves but in the insights gathered from their performance. This isn't just about numbers and charts anymore. Imagine being able to pinpoint exactly which creative elements resonate with your audience, understanding why some ads outperform others, and leveraging this knowledge to not only meet but exceed your marketing objectives.
The "Creative Reporting Blueprint," is your comprehensive guide designed to change your perspective on creative reporting. At the heart of this process are principles that many of us strive to integrate into our workflows: efficiency, productivity, and scalability. That's where the magic happens — when we align our creative reporting practices with these core values, we unlock the potential to not just participate in the market but to lead it.
So, whether you're a seasoned marketer looking to refine your approach or just starting to explore the depths of paid social, this guide is crafted for you. We'll dive into creative reporting, from gathering and analyzing data to making informed decisions that drive your creative testing forward.
The Challenge of Creative Reporting
Creative reporting in paid social advertising is crucial for evaluating campaign success, yet it can be very challenging for creative teams. Most of the creative reporting solutions are very data-dense, which can be far removed from the visual and narrative-driven approach typical of creative work. As a result, creative teams often struggle to interpret it without the help of marketers or data analysts. Creative professionals excel in crafting ads that engage and resonate, but they may find themselves at sea when faced with pages of analytics and metrics that don’t intuitively connect with their creative output.
The disconnect often come from how creative reporting is presented: rows upon rows of numbers and data points that, while rich with potential insights, aren’t immediately accessible or actionable to those steeped in the creative process. This format can make the data seem abstract and difficult to relate back to the specific creative elements it’s meant to evaluate. As a result, creative teams know their content is performing—they just don’t always have a clear understanding of the underlying reasons for that performance, making it challenging to apply these insights to future creative tests.
Interpreting this data effectively requires a skill set that may not come naturally to everyone, especially those whose strengths lie in visual storytelling and design.
The analytics involved in creative reporting demand not just a basic understanding of what each metric means but also the visual aspect, helping to connect data to the actual ad creative.
The solution to bridging this gap doesn’t involve transforming creative professionals into data analysts. Instead, it calls for a rethinking of how creative reporting is structured and delivered.
There’s a need for reporting tools and processes that can translate complex data into a format that’s both accessible and engaging for creative minds. Ideally, such tools would highlight key insights in a visual and intuitive manner, making it clear how specific creative choices impact overall campaign performance and audience engagement.
Setting Up Creative Reporting
The process of setting up creative reporting involves several nuanced steps, each designed to make insights easily available for marketing and creative teams. Let's delve deeper into these steps to understand how to construct a robust reporting framework.
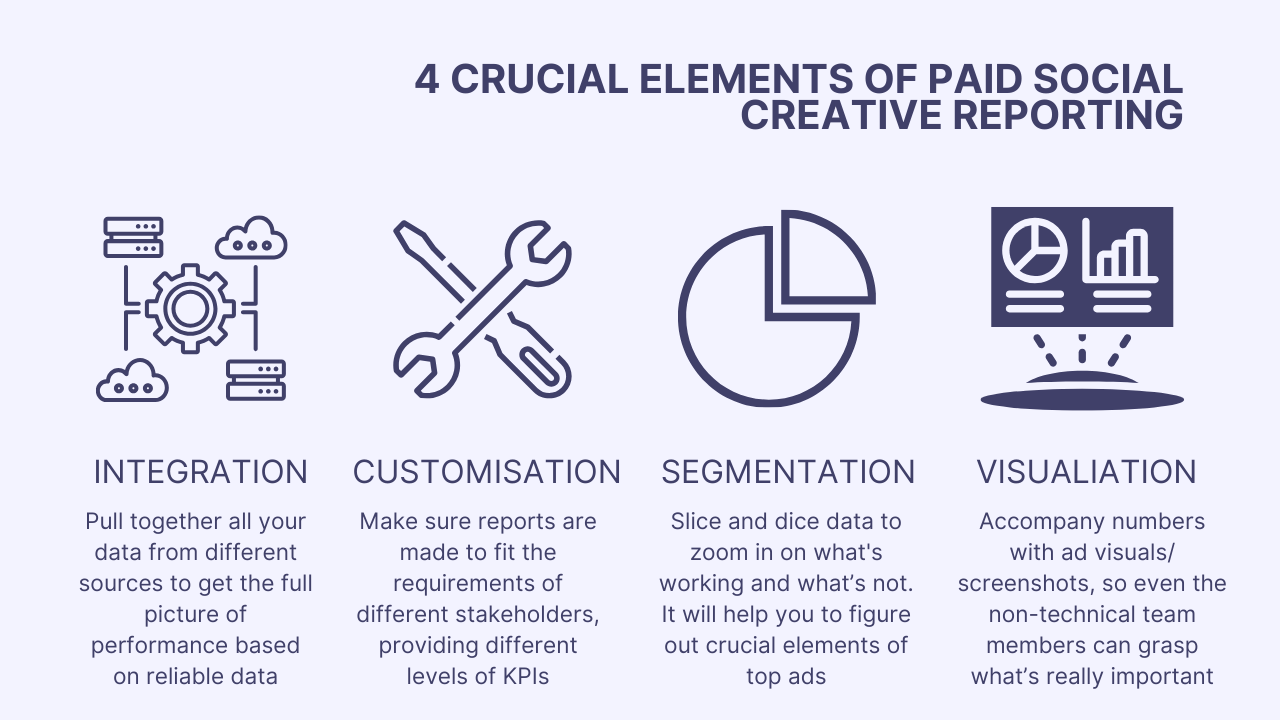
Integration
Data Aggregation
At the heart of an effective creative reporting system lies the crucial step of data integration. This process involves gathering data from an array of sources, including all used paid social platforms like Meta, Pinterest, TikTok, and others. Additionally, it is crucial to incorporate insights from on-site analytics tools like Google Analytics 4 as well as any relevant first-party data your organization holds.
By pulling data from all the sources you get a realistic picture and can evaluate the performance of each creative against your goals. It’s crucial step towards establishing a reporting system that not only sheds light on the performance of your campaigns but also sets the groundwork for creative testing and optimizations that pave the way for future campaign success.
Utilizing Advanced Integration Tools
To facilitate this level of integration, use advanced platforms that are designed to streamline the aggregation of data from the various sources you consider important, providing a unified and consistent data. By using platforms designed for this very purpose, you will get smooth experience that automates the data aggregation process.
This isn't just about saving time or reducing the manual effort involved in collecting data, but about ensuring you never miss an important insight. With automated data gathering, the risk of overlooking essential insights or inaccuracies is significantly minimized. This system works tirelessly behind the scenes, ensuring that your creative reporting is always fueled by the most complete and accurate data available.
Report Customization
Customization is a crucial element in the area of creative reporting. It's not just about generating reports. It's about tailoring these reports to serve the unique needs and goals of various stakeholders within your company. From C-level executives seeking high-level insights to creative teams drilling down into the specifics of ad performance, customization ensures that each report is both relevant and actionable.
So, the first step in crafting effective reports is understanding who the report is for and what decisions it will inform. This means selecting KPIs that align with the overarching objectives of your campaigns and the strategic goals of your organization. For instance, while a C-level executive might prioritize ROI and overall campaign performance, a creative team may look for engagement metrics and creative-specific performance data. The beauty of customization is in its flexibility to adapt—ensuring that each report generated provides value and drives decision-making.
Segmentation and Drill-Down Functions
Segmentation plays a crucial role for braking down your data to uncover nuanced insights. By segmenting data by campaign or ad level, ad platforms, or creative types, you unlock the ability to perform targeted analyses that reveal how different tactics affect your performance.
This level of customisation allows for deep dives into specific areas of interest, enabling teams to identify trends, opportunities, and areas needing improvement. Whether it's understanding which creative resonates best with your target audience or determining the call to action that delivers the highest ROI, segmentation ensures your analysis is detailed and insightful.
Visualizations and Dashboards
In a world of data, visualizations serve as a lighthouse, guiding stakeholders to key insights and trends. Dashboards and visual analytics transform raw data into intuitive, easily digestible formats, making it simpler for teams to grasp complex information at a glance. If you excel in visualisation, you will easily create custom dashboards that highlight essential KPIs, trends, and performance metrics.
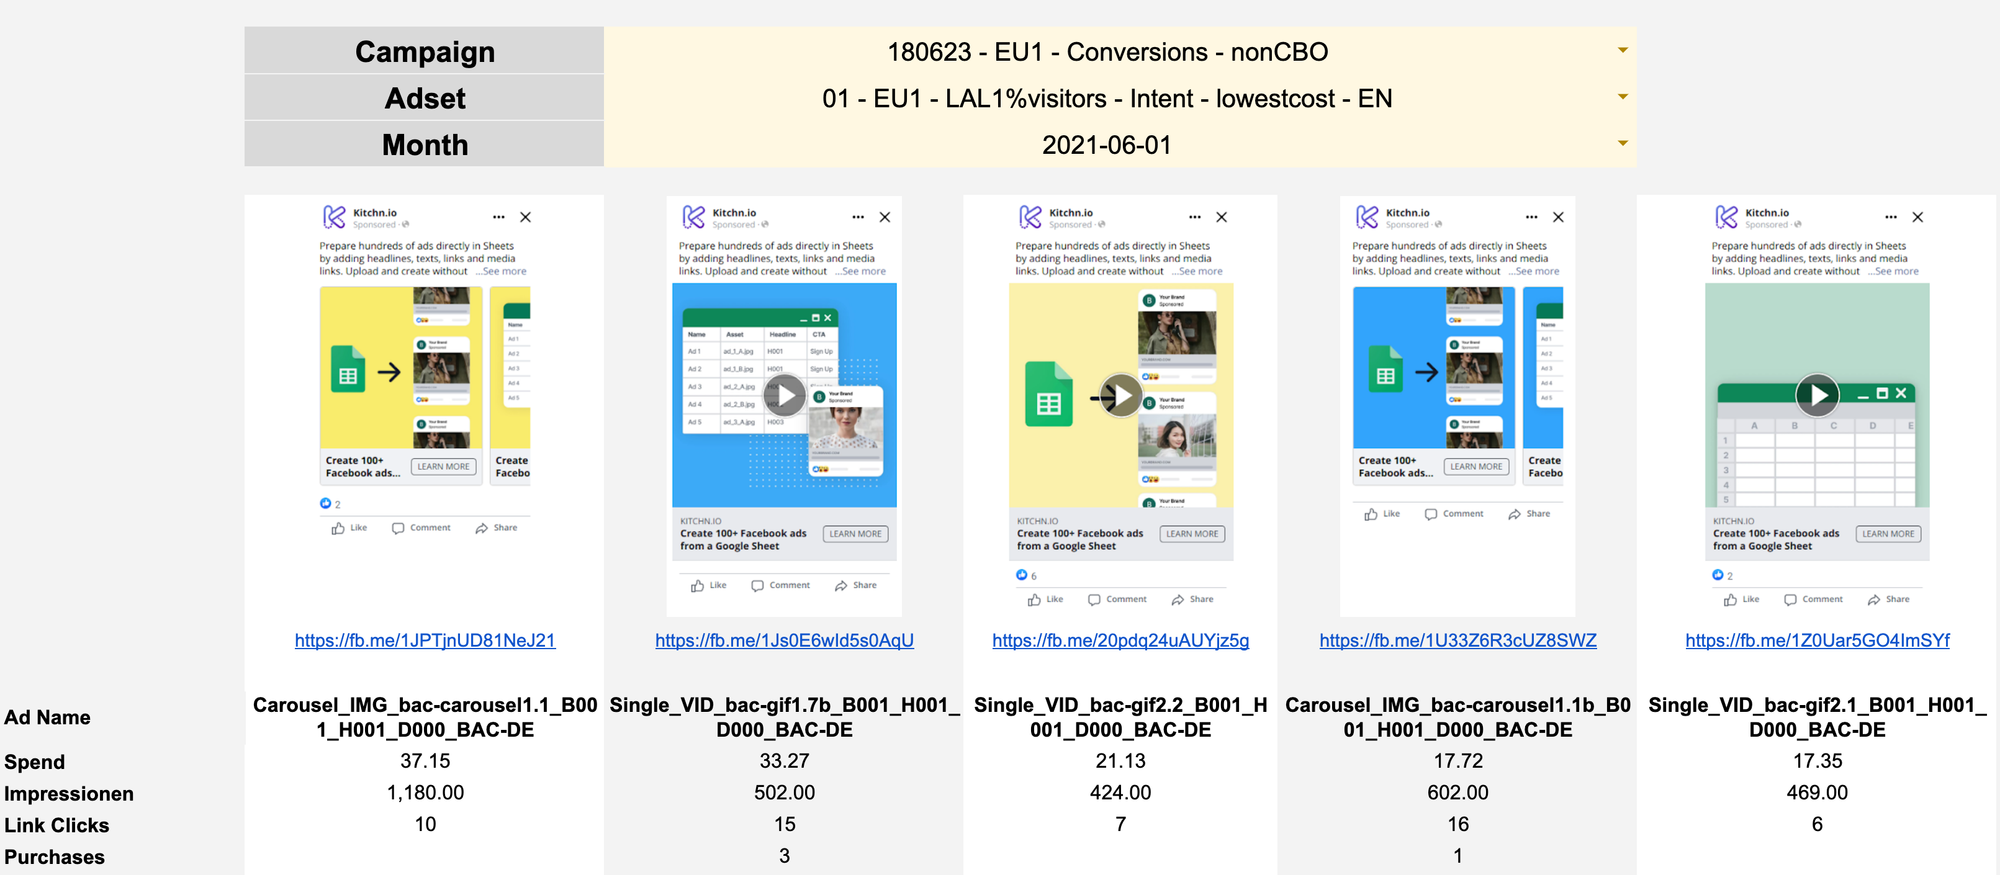
For the creative teams, as mentioned earlier, it’s crucial to connect data and the visuals to ease the understanding of the most important KPIs and connect them to the visual elements of the ad creatives. Screenhots and preview link, for example, can bring data to life, facilitating a quicker understanding and enabling immediate action.
In summary, customization in creative reporting isn't just about personalizing reports—it's about making data work harder for you. By tailoring reports to meet the specific needs of different stakeholders, leveraging segmentation for in-depth analysis, and utilizing visualizations for clearer insights, creative reporting empowers teams to harness their data fully. In doing so, it not only streamlines the decision-making process but also paves the way for more strategic, data-driven approaches to creative testing and analytics.
Turning Data into Actionable insights
Turning data into actionable insights and strategic decisions is the cornerstone of performance marketing and paid social advertising.
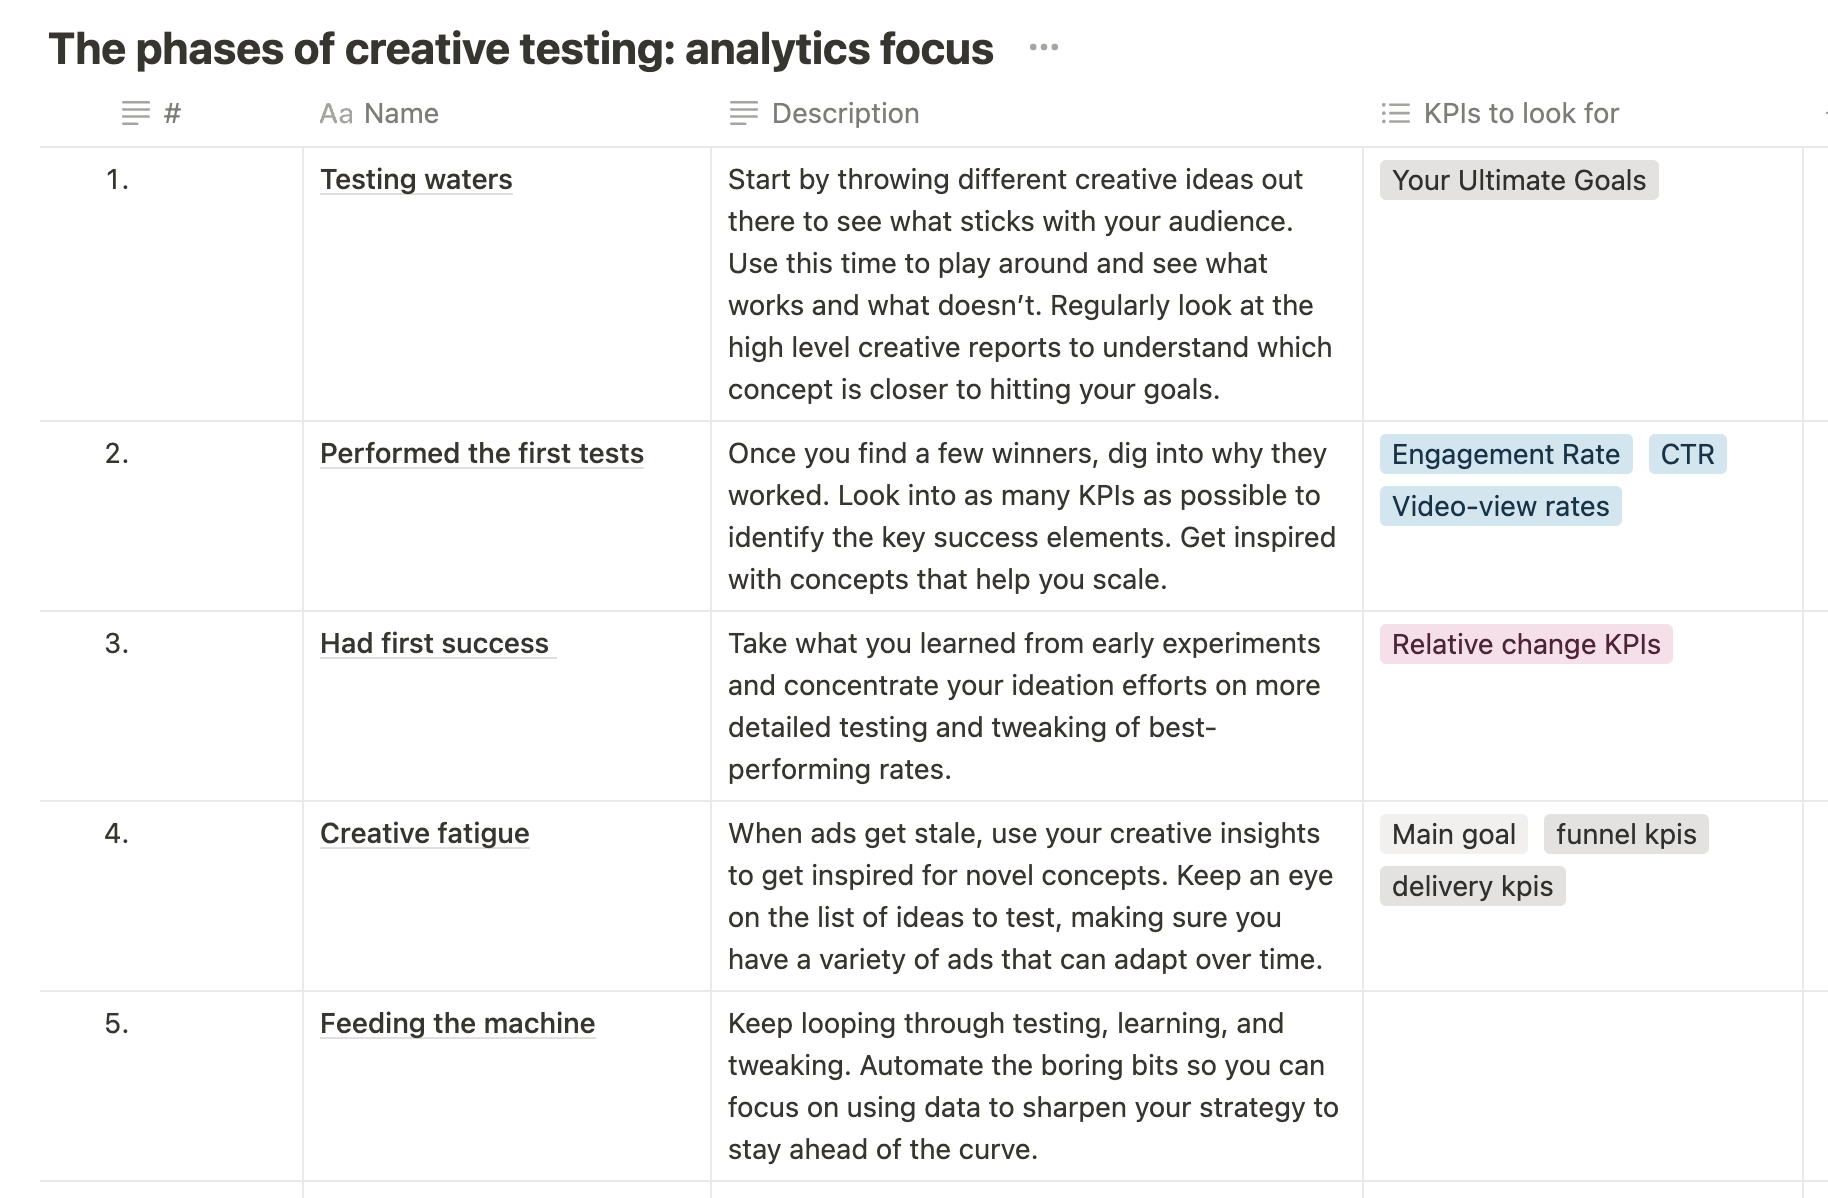
In our creative testing blueprint, we have developed a framework, which outlines stages of creative testing from testing waters to feeding the machine, we can understand how to evolve our creative strategies to maximize return on investment systematically. The data from creative reports will indicate you where you need to do more and where less. Here's how to transform creative reporting data into a strategic asset for continuous optimization and learning.
Insight Generation
Testing Waters & First Tests
For those in the early stages of developing Facebook ad creatives, the focus should be on gathering a wide array of data to understand what resonates with your audience. Use these initial phases to experiment with different creative concepts, targeting strategies, and messaging.
Analyzing performance data helps identify patterns or elements that contribute to an ad's success or failure. Look for insights not just in high-performing creatives but also in those that failed to meet expectations to understand what to avoid in the future.
Had First Success & Creative Fatigue
Once you've identified one or two performing creatives, dive deeper into the data to understand why these were successful. Compare them against less successful ads to pinpoint what made them stand out. Was it the imagery, the copy, or the call-to-action? As you encounter creative fatigue, use data to refresh your understanding of engagement, exploring new creative angles that can sustain or improve performance without escalating costs.
Strategic Decision Making
Performed the First Tests & Had First Success
Use insights from your initial tests to make informed decisions about where to allocate your budget. If certain creatives start showing promise, consider reallocating resources to these areas for further testing and refinement.
This stage is also crucial for planning A/B tests with a more strategic focus, testing not just creative elements but also audience, bidding and ad set settings.
Creative Fatigue & Feeding the Machine
For those experiencing creative fatigue or looking to make the creative production process more efficient, strategic decision-making involves scaling what works and innovating around what doesn't. Data from creative reporting should guide the development of new creatives, the retirement or iteration of fatigued ads, and the exploration of new platforms or audience segments.
At this stage, decisions should also consider the long-term sustainability of creative performance, focusing on building a diverse creative portfolio that can withstand market changes and platform algorithm updates.
Continuous Optimization and Learning
Across all stages, the emphasis should be on the iterative nature of creative reporting. Each cycle of data collection, analysis, and action provides new learning opportunities.
Creative reporting will facilitate this continuous optimization process, especially when you automate data aggregation, enable data segmentation and filtering, detailed analysis, and support the rapid deployment of test campaigns.
As you progress from testing waters to efficiently feeding the machine, remember that each piece of data holds the potential to refine your strategy further. Continuous learning from data not only helps in optimizing current campaigns but also in foreseeing future trends and preparing your strategy to leverage them effectively.
Conclusion
In a world where creative testing almost entirely defines the campaign success, mastering creative reporting is not just an option—it's a necessity. Our "Creative Reporting Blueprint" is more than just a guide, but a transformative approach designed to help you build up your marketing strategies from the ground up. Through integration, customization, and a commitment to turning data into actionable strategy, this blueprint is your key to unlocking the true potential of your creative testing.
In conclusion, the future of advertising demands more than just creative brilliance or analytical expertise alone—it calls for a seamless blend of both. As you implement our strategies, remember that the goal is not just to analyze but to understand. With Kitchn.io by your side, you're well-equipped to turn your data into competitive advantage, leveraging strategic innovation to bring your team to new heights of success.